

Business intelligence tools have been around for decades. What has changed is the technology inside them, and what people now expect when they sit down with their own data.
Power BI is a way of displaying your data and giving you the tools to interact with it: sorting, filtering, and digging in, rather than scrolling through rows and columns in a static report. That is what separates a real BI tool from a plain report. A well-built dashboard does not just display information. It shows you something specific enough to act on.
What Power BI Is and Why Manufacturers Are Adopting It
Any BI strategy depends on timely, accurate data. If reporting is not close to real time, the information is already stale by the time someone looks at it. Once that happens, people stop trusting the numbers and stop using the tool. This is one of the most common issues we see: teams that already know their data needs fixing, but have not gotten there yet.
For manufacturers, this matters more than in most industries because decisions tied to profitability get made work order by work order. We worked with one manufacturer doing a significant amount of business with a large, well-known customer. That relationship made up a sizable share of his revenue, but he genuinely did not know whether it was profitable. He had to decide whether to keep expanding that account or focus his time on smaller customers who were making him more money. That is the kind of visibility manufacturers need, and it is difficult to get without pulling every relevant number into one place.
Where Power BI Fits in the Manufacturing Industry Today
Business intelligence used to be something only executives looked at. That is still true, but it is no longer the whole picture. Today it also serves the people placing orders and the people running the floor.
Some of the best-performing manufacturers we work with mount flat-screen TVs around the plant, showing real-time metrics to the people doing the work: how they are performing against the goals that have been set for them. Getting that feedback in real time, instead of once a month in a review, changes how a team performs.
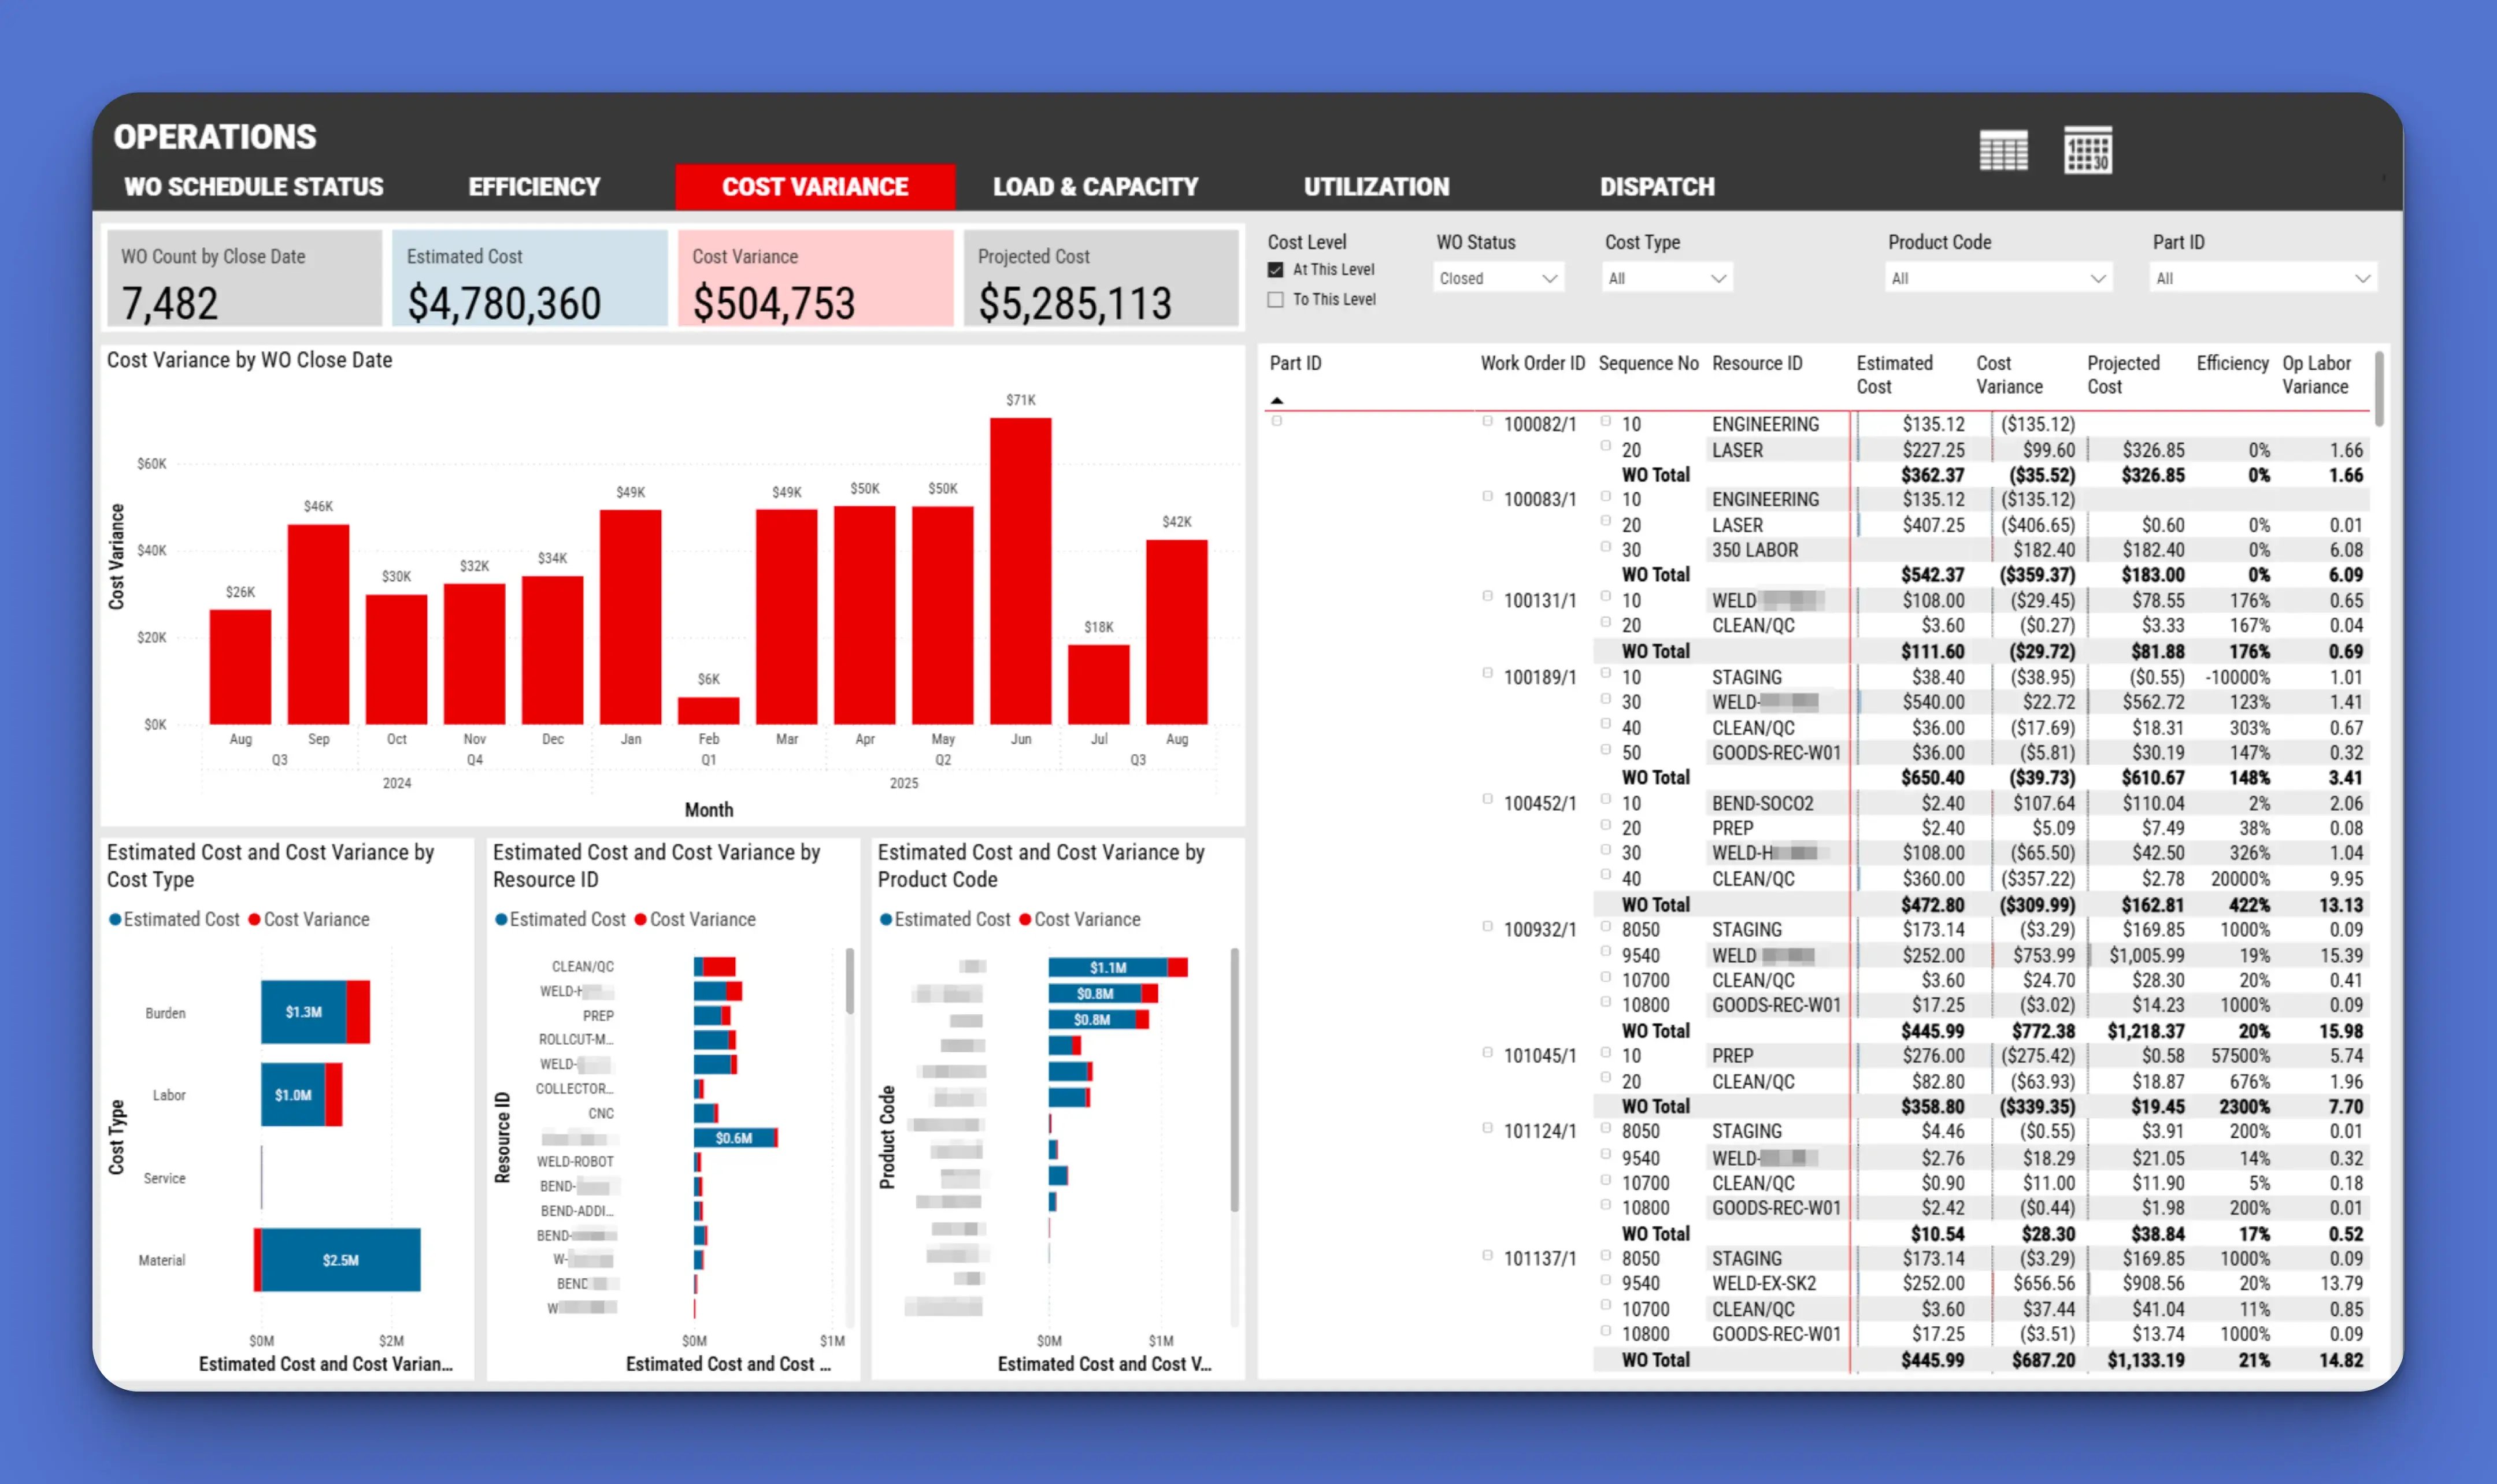
Real-time visibility also changes how quickly problems get caught. If a work order is trending 50% over cost while the team is only two days into a ten-day job, there is still time to intervene. Without that visibility, the overrun is not discovered until the job is closed, and by then it is too late to change the outcome.
Core Manufacturing Power BI Dashboards You Should Know
Most manufacturing dashboards fall into a few categories:
- Labor dashboards (efficiency, utilization, supervisor sign-off) tend to reveal the most about day-to-day performance. It is common to find two employees doing the same job with very different efficiency numbers. That gap is useful on its own, but the real value comes from what happens next: additional training for one employee, or documenting a better process the other employee already figured out.
- Financial dashboards (margin trends, cost variance) matter to more than the finance team. A plant manager wants to know how their operation is contributing to margin expansion or erosion.
- Operational dashboards, especially on-time delivery, tend to be what convinces a skeptic the investment is worth it. Once a team can track OTD easily, that is often what pushes them further down the Power BI path.
- Downtime tracking matters too: what unplanned downtime costs, and how it ripples into margin and delivery performance.
For a closer look at real examples manufacturers are using today, we have broken down 10 real Power BI report examples in more depth.
Do You Need a Dashboard Template, or a Custom Build?
Any report or visualization can be built from scratch, but starting from scratch generally takes more refinement than starting from something pre-built. We have developed dashboard content over the years based on what customers actually asked for. Some customers plug it in and it works as-is. More often, they plug it in, use it for a while, and then realize they need to see something a little differently for their own operation.
That is not a failure of the template. It is usually the fastest way to get to the real conversation about what a company actually needs.
Getting Started: The Data Sources You'll Need
Business intelligence is not limited to your ERP. Manufacturers we work with typically pull data from several places into a single view, including:
- The ERP system itself
- Quality management systems (QMS)
- HR systems (HRIS)
- Machine and plant-floor data
The ERP is usually the hardest of these to keep clean, simply because it holds nearly everything about how a manufacturing company runs. We work with our customers to understand where the data is, and then help put a strategy together for how to normalize it, gather it, and keep it clean so that it is trustworthy once it is being used for decisions.
Related: How & Why to Integrate Power BI With Your ERP
Common Pitfalls When Rolling Out Power BI on the Plant Floor
The most common issue is a mismatch between what people call something informally and what the ERP actually calls it. A team might refer to a number as “revenue” but in the system that number is actually called invoiced sale. If that mismatch goes uncaught, the dashboard reports something wrong, and trust erodes quickly.
Trust builds when everyone pulls from the same source. It breaks down when people go to different places for the same number, because then nobody agrees on what is true, and the data inside the ERP starts to lose value. Getting the whole team onto one source of truth is most of the battle.
Related: How Does a Power BI Consultant Help a Manufacturing Company?
Ready to Get Started With Power BI?
The takeaway: do not wait for perfect data to get started. The sooner a team has real visibility into what is happening on the floor, the sooner they can act on it instead of finding out after the fact.
Reach out for a free consultation if you want to talk through what that could look like for your operation. We will figure out where you are and go from there.